Wednesday, December 22, 2021

Looking back to understand how communities respond to sea level rise

Photo of coastal flooding on Camano Island by Joan Schrammeck

In the sea level rise planning world we do a good bit of fretting about what sort of responses we might expect from the human communities along the shoreline, experiencing impacts associated with sea level rise.  We often emphasize that there is no precedent for understanding how human communities will respond, given that the sea level change we are expecting is, itself, unprecedented.  But this, of course, is not true.  Sea level HAS risen during the Holocene:

Estimated sea level curves for the past 15,000 years for the Strait of Juan de Fuca and globally.  From here.

during time periods when the human population was also increasing, and even when humanity was beginning to settle into communities:

Estimated global population over the last 12,000 years.  From here.  

So it is perhaps not at all a stretch to imagine that there are some templates out there for understanding how people may have responded.  Indeed, its also not a stretch to imagine that the earliest occupants of the Olympic Peninsula observed and experienced sea level change, something i've mused on in the past, though the traces of those people on the landscape are few and far between.  A few more detailed examples are starting to emerge, though, that perhaps point to a variety of responses, including one just out of last week's 2021 AGU meetingIn this case a fascinating bit of modeling examining how local sea level in Greenland probably responded to the advance of the Greenland ice sheet during the Little Ice Age suggests that sea level rose quite dramatically in places colonized by Icelanders, and may help to explain the sudden departure of those people back to Iceland.  So, perhaps, an example from the past of one of the three big strategies:  retreat.  

A photo, from Galili et al., showing the remnants of a submerged, 7000 year old sea wall off of the coast of present-day Israel.

In 2019 I was a bit obsessed with another widely-reported paper, published by a team from Israel, describing the remnants of a 7000 year old seawall that now sits under about 20 feet of water.  The authors presume that this is one of the earliest known examples of another of the big three strategies:  protect.  In this case, presumably, the approach was ultimately unsuccessful.


Tuesday, November 30, 2021

Over a decade of Elwha grain size images


A grain size image collected on 23 November 2011, from about here on the Elwha River delta, at an elevation of 2.5 m MLLW

Over the past few weeks I've been spending unseemly amounts of time sorting and curating approximately 13000 grain size images, like the one shown above, collected over the past 13 years on the Elwha River delta.  Once I can get them organized and named, the idea is that they will be run through a classification algorithm developed by Dan Buscombe, and we will have in our hands one of the most comprehensive beach grain size data-sets ever assembled.  The idea is to evaluate how grain size on the beach changed before, during and after dam removal dumped thousands of tonnes of dam-trapped sediment at the river mouth.  We've published the papers that describe the topographic change associated with that sediment, and we know that beach substrates fundamentally changed because of dam removal.  As an example, the grain size photo collected at the site of the photo at top just last month (10 years on), looks like this:


Grain size image collected on 4 November 2021, from about here on the Elwha River delta, at an elevation of 2.5 m MLLW

But what we haven't yet done, outside of an early and middling effort in this paper, is quantified the grain sizes from the photos (which you can do using a variety of digital grain size techniques), and really analyzed the data quantitatively through time.  Doing so will allow us to see new patterns, and hopefully connect the grain size changes to topographic change, river sediment delivery, and possibly oceanographic processes (i.e. waves and tides).  

13,000 images...that is insane to think about, and represents a LOT of my time over the past 13 years.  What does that look like?  Mapping the photos doesn't really do it justice, as they are collected on transects...so they sort of stack on top of each through time...but there is a go:

Recent aerial image of the Elwha River delta, overlaid with locations of photos collected during ~50 grain size surveys over 10 years.  Each color represents a different day. 


Wednesday, October 6, 2021

Kelp growing on tubeworms


Steve Rubin of the USGS collecting data while buried in kelp fronds. 29 August 2021 photo by Ian Miller

I had the opportunity to once more join the Elwha Interagency Dive Team this summer, suiting up, as I have for the last 13 years, to survey sub-tidal sites scattered along the central Strait of Juan de Fuca.  I've posted frequently in the past about these surveys, and what we see each summer.  I wanted to focus this year on an interesting phenomenon that I haven't really seen described well elsewhere - kelp growing on tubeworms.  

Bull kelp fluttering in the current near the Elwha River mouth. 28 August 2021 photo by Ian Miller

First off, kelps were heavily impacted during removal of the Elwha dams, primarily due to reduced light as sediment laden water shaded the seafloor.  One of our motivations for continuing our surveys is associated with tracking and trying to understand the pace of kelp recovery after that die-back event...and in fact our survey work this year was funded as part of a larger, region-wide, kelp restoration and recovery effort.  Largely that recovery seems to have happened around the Elwha River mouth, with the notable exception of the handful of sites where formerly coarse substrates were buried by finer sediments. 

Steve Rubin of the USGS emerging out of a plume of fine sediment, kicked up at a site that used to host a higher density of kelps...but where the substrate is now fine enough that kelps have a hard time finding a place to grow.  2 August 2021 photo by Ian Miller

Kelps typically like to attach to and grown on coarse substrates - either bedrock, boulders or large cobbles on the seafloor that allow kelps stay in place in the fierce currents that characterize many of the places they like to live.  

Kelp stipes attached to cobbles.  As the kelp grew larger they eventually became buoyant enough that these cobbles have been picked up off the seafloor.  14 September 2021 photo by Ian Miller

But in places where there isn't suitable substrate we've found that kelps can still grow by attaching to other organisms, notably tubeworms, which build strong and stable tubes that anchor them in soft substrates.  

A tubeworm tube, in this case Eudistylia vancouverii, emerging out of soft sediment at a site near the Elwha River mouth.  28 August 2021 photo by Ian Miller

We've seen this at sites around the Elwha in the past, but this year the phenomenon was very notable at a site right about here, to the west of the Elwha River mouth.  This site has always been a good one for tubeworms, perhaps because its a generally pretty silty site.   This year kelps, especially Bull kelp (Nereocystis leutkeana), found those tubeworms to be an attractive substrate to grow on.  As I cruised around here after we finished our survey I was struck that MOST of the Bull kelp I observed at this site was growing on a tubeworm.  
A Bull kelp holdfast and stipe.  The holdfast here is growing on and around a tubeworm tube.  28 August 2021 photo by Ian Miller

Close up of a Bull kelp holdfast growing on and over a tubeworm.  The tubeworm tube provides an extraordinarily stable and strong substrate for growth, that can support fully grown Bull kelp.  28 August 2021 photo by Ian Miller


Thursday, August 12, 2021

IPCC sea level rise hot take

 The 6th IPCC Assessment report was released yesterday (find the full report here), which provides a good motivation for digging into any new sea level insights they summarize, and also to start to work out what the IPCC's new global projections mean for Washington State (and how they compare to the projections we released in 2018).  

Time-series of ice mass loss in Greenland, published by NASA 

First off, a few interesting nuggets from the section on observed changes in the Summary for Policy Makers (mostly pages SPM-5 and SPM-6):  Contributions to sea level change from melting ice became the dominant contributor sometime around the beginning of the 21st century - prior to that contributions from thermal expansion were about equal to those from melting ice.  This is a big change, as sea level contributions from melting ice are more uncertain, and potentially far larger as we move through the 21st century, than those from thermal expansion.  The IPCC report ascribes a strong confidence ("very likely" in IPCC parlance) that melting in Greenland (see figure above or here) is associated with anthropogenic forcing, whereas finds "only limited evidence, with medium agreement, of human influence on the Antarctic Ice Sheet mass loss" (which again, NASA visualizes here).  Also, observed global average sea level rise since 1900 is pegged at about 8 inches...if it were to stay there for the 21st century we would be doing quite well.  The problem is that the IPCC assigns "high confidence" to rates of global average sea level rise having accelerated already in the 21st century.   

On to the projections:

Summary global average sea level projections from the IPCC 6th AR.

There aren't huge changes to the overall sea level change picture in this AR.  There is a new family of emissions scenarios but each is still tied to a particular level of radiative forcing, so its easy to do a quick comparison to projections associated with the RCP family of emissions scenarios.  For each emission scenario the IPCC focuses on a "likely range" around their best estimate, that is intended to represent the zone of uncertainty between the 17th and 83rd percentile of a probability distribution - and I found this acknowledgement of uncertainty in a probabilistic framework to be useful.  Generally we see projections in the ~close-to-1-meter zone for the higher emissions scenarios, and somewhere in the 0.5 meter zone by 2100 for the lower emissions scenarios...about what we've been working with for a while. 

They also state, "only likely ranges are assessed...due to difficulties in estimating the distribution of deeply uncertain processes".  The IPCC has NOT adopted the expert elicitation process that was used to define the tails of the uncertainty distribution that we used in our 2018 report, which I think is fine.  Interestingly, though, the IPCC sort of gives a nod to the upper part of the uncertainty distribution, and also includes a "low-likelihood, high impact scenario" in this AR, which is included presumably because of the hints that Antarctica is giving to the world about possibly bigger-than-expected contributions to sea level rise in the future.  In our 2018 report these high magnitude low likelihood scenarios were built into the model (again, using expert elicitation), but the message from both of these approaches is the same...there is a "can't be excluded as a possibility" chance of some pretty significant sea level rise this century, that will represent a significant strain on coastal communities and landscapes everywhere:  whether you think of it as having a 1% chance of happening, or you think of it as a "low-likelihood" scenario perhaps doesn't matter so much.  In this AR the IPCC also provides a 2300 projection, presumably to emphasize that, after the 2100 time horizon, sea level rise isn't going to slow down, regardless of the chosen emission scenario.   

Projections from our 2018 SLR assessment for Washington State, localized for Seattle (and available here).

To take things a bit further, the NASA sea level change team worked with the IPCC to develop a localized sea level viewer for the 6th AR projections, and they include projections for Seattle:

Seattle projections from the IPCC 6th AR for SSP-8.5 out to 2150, available through the NASA Sea Level Change portal.

which provides an easy way to do an apple-to-apples (or close to) comparison with our 2018 projections (shown above).  For 2100 for Seattle for the SSP-8.5 scenario they project sea level 0.69 meters above present, with a likely range between 0.51 and 0.98 meters.  Our projections suggest 0.70 meters by 2100, with a likely range between 0.51 and 0.94 meters...basically dead on equivalent.  

The differences, of course, are in the upper part of the uncertainty distribution.  We, for example, allow users to access a 1% chance sea level scenario, which comes in at 1.55 meters by 2100 for Seattle, whereas the IPCC opted to include a "low confidence" scenario, which they peg at 0.81 meters by 2100.  They DO though include a "likely range" for this "low confidence" scenario (which I'm having a hard time wrapping my brain around), which ranges between 0.51 and 1.45 meters.  Its also worth noting that the 0.81 meter 2100 "low confidence" scenario projection falls within their "likely range" for the "normal confidence" projections...again something that I can't quite figure out how to interpret.  Clearly, the upper part of the sea level rise uncertainty distribution remains a bit of a bugaboo.


Monday, July 12, 2021

Heat in the lower intertidal: The role of tidal propagation


9 July 2021 photo of dead cockles from the intertidal off of Marrowstone Island 

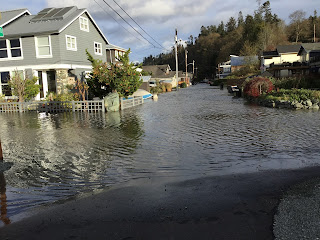
By this point the intertidal ramifications of the late June Pacific Northwest heat wave have been well reported on, with some pretty dire accounts coming in from throughout the Salish Sea and Pacific coast region of Washington and British Columbia.  I've been seeing the influence as I visit various shorelines, including dead cockles on Marrowstone Island (photo above), and the same off of the Dungeness River delta:

7 July 2021 photo of more dead cockles, taken about here on the Dungeness River delta.  

Yesterday I also hunted around Kalaloch Beach on the coast of Washington and for the most part was impressed by how little mortality there seemed to be on the intertidal rocks, though some impacts were visible:

11 July 2021, dead mussels still attached to the rock on the rocks in the lower intertidal at Kalaloch about here.

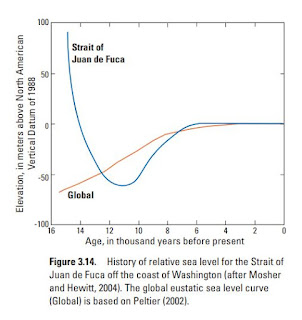
There has been one interesting wrinkle to the interaction between that June heat wave and the very low tides that weekend that I wanted to focus on a bit, which has to do with the pattern of propagation of tides from the Washington Coast into and through the Salish Sea.  Low tides in the summer tend to occur during the daytime in coastal Washington, but not at the same time during the day.  The low tide propagates as a wave, with the trough (i.e. the lowest part of the tide) generally hitting the outer coast in the morning, generally reaching the eastern Strait of Juan de Fuca about two hours later (generally late morning), reaching Seattle in the after-lunch hours in general, and then reaching Olympia about an hour after that.  So the long and the short of it is that a low tide that is lowest at La Push on the Washington coast at 8am in the morning won't reach Olympia until 5.5 hours later, at 1:30 pm.  

Measured water level along a west-to-east gradient - at La Push, Port Angeles, and Friday Harbor - on Monday June 28th 2021, illustrating the pace of propagation of the low tide from the coast into the Strait of Juan de Fuca. 

So what this means, of course, is that the heating of the intertidal will be different along that spatial gradient as well, since temperature varies so much throughout the day, and is generally highest in the afternoon.  Its much more likely that uncomfortable temperatures will be reached in the lower intertidal in south Puget Sound, for example, as compared to the coast, just because the summer low tides occur later in the day when its warmer.  

So was this evident during the heat wave?  It appears so, at least based on a quick look at air temperature data collected at some tide gauges, that I was able to couple with water level data.  I ended up working with data from La Push, Port Angeles and Friday Harbor simply because I'm well set up to download and manipulate data served from the NOAA tides and currents website, but found that air temperature were not available for any of the Puget Sound stations (i.e. Seattle or Tacoma), so wasn't able to incorporate those locations into my analysis.  But La Push, Port Angeles and Friday Harbor provided me with plenty to work with.  

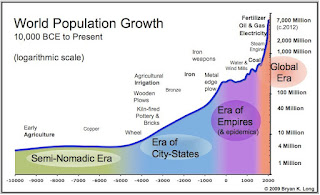
Air temperature recorded at tide gauges in La Push, Port Angeles and Friday Harbor during the late June heat wave

So I focused in on the three hottest days - Saturday the 27th, Sunday the 28th and Monday the 29th...and the air temperature recorded at three tide gauges are shown above.  The first thing that pops out to me is that La Push was considerably cooler than Port Angeles and Friday Harbor, especially on Saturday and Sunday.  Not a huge surprise.  Generally temperatures were a bit warmer in Friday Harbor as compared to Port Angeles, though not by a lot.  Interesting, on both Sunday and Monday Friday Harbor cooled an hour or so sooner than Port Angeles at the end of the day...something I tentatively attribute to shading of the stations as the sun drops (Friday Harbor's station would be blocked in the late afternoon by the mass of San Juan Island, whereas the Port Angeles tide gauge likely doesn't have that same later afternoon shading).  

My next step was to couple those air temperature data with water level data to calculate how much time various elevations in the intertidal exceeded a critical threshold temperature...I chose 25 degrees celsius as a relevant ecological threshold based on conversations with a few marine ecologists.  Perhaps not surprisingly given the air temperature time-series above, when I calculate the hours above 25 degrees celsius and plot it as an elevation profile I get this for the three locations:

Amount of time (in hours) that various intertidal elevations exceeded 25 degrees celsius between 27 and 29 June 2021 at three locations in coastal Washington

In the profiles, La Push stands out here as having way less exposure to temperatures over 25 celsius...simply because it was cooler there, especially on Saturday and Sunday.  Before I move on though, its worth noting that the data from La Push do suggest heating exposure over 25C really low in the intertidal (i.e. below MLLW), and even though its nothing compared to what the intertidal to the east likely experienced, it may be unprecedented.  The NOAA buoy that sits off the Washington Coast off of Taholah, for example, has only measured hourly average air temperature over 25 degrees celsius 34 times since 1988 (all during a series of warm days in September 2017 that did not correspond with low tides).  

Average number of hours exceeding 25C for the lowest part of the intertidal (below MLLW) in La Push, Port Angeles and Friday Harbor (top panel), and the same but expressed as a percentage of the total number of hours between 27 and 29 June 2021 that were above 25C.  This is where we see the influence of the later low tides inside the Salish Sea.

Okay, but can we see an influence of tidal propagation in heating?  Yes we do.  In the bar plot above I averaged the number of hours over 25C experienced by the lowest parts of the intertidal (below MLLW) at each of the three location, and we see that west to east gradient.  Again, that COULD just be due to it being a bit warmer in Friday Harbor than it was in Port Angeles and La Push, but the difference between Port Angeles and Friday Harbor is telling - the tide gauge in Port Angeles actually experienced more time above 25C (31.7 hours in Port Angeles over those three days, versus 30.7 hours in Friday Harbor)...but there were more hours at the Friday Harbor tide gauge that the lowest part of the intertidal (again below MLLW) experienced those elevated temperatures (4.8 hours in Friday Harbor versus 3.8 in Port Angeles).  To pull that out a bit I've expressed it as a percentage of the total time exceeding 25C at those three locations (lower panel in the figure above)...and we still see that gradient...that is the tidal influence at work.

I hadn't really thought of this interaction between tidal propagation and daily heating before, but since heating and dessication are critical stressors for intertidal organisms it may exert an important influence on what can live in the intertidal in various parts of coastal Washington.  The low intertidal of south Puget Sound is likely a very different place to live than the lower intertidal of the coast of Washington, and not only because of the wave protection differences and the different geology and geography.


Monday, June 7, 2021

Coastal storm forensics on Ediz Hook


Looking to the east from about here.  The area of overwash referenced in the text below is just out of the frame to the left.

With permission from the US Coast Guard I made my annual trip last week out to the end of Ediz Hook, to survey the shoreline. I was struck on this trip by the sign left beyond by what looked to be a pretty exciting storm that must have happened this winter, that both eroded and over-washed the berm on the northern shoreline of the hook, and flooded the large grassy field that used to host the lighhouse that sat at the end of the hook.

Overwash is driven by waves, typically coupled with a high still water level (there is some cool footage of overwash in action from North Carolina here...), and sort of by definition leads to flooding behind the berm.  That looks to be what happened here.  I surveyed in the extent of the overwash I could observe, and found it to be pretty extensive:

Mapped overwash deposit (the tan polygon) on Ediz Hook - surveyed 26 May 2021

The signs of the event are also readily observable in some of the beach profiles I collected from within the overwash zone - showing an eroded beach and berm as well as the overwash deposit behind the beach:

Profile data from inside the overwash zone from 2020 and 2021

   I also surveyed the debris line that would have roughly demarcated the area flooded by this storm:

Mapped flood extent based on the location of a debris line, surveyed 26 May 2021

So when did it happen?  That is a bit hard to say, but if I had to guess I would think that it must have been associated with one of the two storm events of note from this winter, one in November 2020 and the other in January 2021.  I wrote about both events in this blog (i.e. here for the January 12th event), but was in Friday Harbor for the November event, so didn't really get a first hand view of what it looked like in the Strait.  Between the two events the highest still water level, or the water level as recorded by the tide gauge, was just over 0.75 meters relative to MHHW, associated with the November 2020 event.  But that doesn't get us very far - the peak of the berm in the overwash zone I mapped on Ediz Hook, though, sits almost 2 meters above MHHW - so the still water level elevation would come nowhere near to over-topping the berm and flooding the land behind.  

My write-ups clearly suggest that both events were characterized by wind and waves, and the data suggest that both events featured wave heights of well over one meter in the Strait.  But if we look in more detail at the co-occurence of wind and waves with still water level the evidence seems to point clearly to the January 2021 event as the culprit.  Specifically, I calculated an estimate of total water level - or the elevation that water would reach on the beach during a storm under the influence of tides, storm surges and wave run-up - using data from the Port Angeles tide gauge coupled with wave data collected at the New Dungeness buoy.  Now first let me make it clear that this is far from a perfect way to estimate total water level...and acknowledge that waves striking Ediz Hook during a storm may be very different than those recorded some 30+ kilometers away.  But assuming that the New Dungeness buoy is somewhat representative of waves in the central Strait of Juan de Fuca my total water level model suggests that the peak total water level this past winter was reached on 12 January 2021, that it probably exceeded the elevation of the berm on Ediz Hook, and that it may have been the only event this winter that exceeded that critical berm elevation threshold:
Estimated total water level on Ediz Hook based on water level data from the Port Angeles tide gauge and wave records from the New Dungeness buoy.  The dashed line is the estimated elevation of the beach berm on the end of Ediz Hook.

Fortunately, in this case, there wasn't much in the way of the damage to infrastructure, and my subsequent follow-up with USCG personnel suggested they didn't even note this erosion or flooding.  


Friday, May 21, 2021

Going, going, gone: Coastal retreat in practice

I often hear of the concept of coastal retreat talked of in rather hushed terms, as if it is an impossibility.  But in fact, it happens quite frequently, though with very poor tracking and monitoring.  As an example I've been following the relocation of a building on Ediz Hook which is now used as our community rowing club's headquarters:

February 2020 photo of the rowing club boathouse on Ediz Hook

This building has been around for quite some time - here it is visible in a 1990 aerial photograph that is included in Google Earth:

1990 aerial image of Ediz Hook showing what is now the boathouse

But placement on, or in this case, over:

April 23 2020 photo of the boathouse showing its seaward overhang and the set of pilings placed on the beach that it rests on

 a dynamic shoreline would take its toll on any building, and over time the building sustained enough damage that the costs of keeping it in its current location, I'm assuming, became untenable.  As a result, the building was moved.  The site above now looks like:

30 April 2021 photo of the former boathouse site

The remaining pilings and framing are slated to be removed this summer, associated with a restoration project led by the Lower Elwha Klallam Tribe.  

The building itself is still around, and will continue its life as the rowing club's headquarters...just in a new and hopefully safer location:

30 April 2021 photo of the re-located boathouse


Friday, April 30, 2021

A record price for shoreline property

August 2016 aerial oblique of a stretch of shoreline on the Dungeness River delta on the Olympic Peninsula.  The home referenced below is the 4th from the left.

An associate recently sent me a message, referring me to a Facebook post by a local real estate agency on Washington's Olympic Peninsula.  The message read, "Sequim's highest home sale price EVER just closed today!".   The thing that made this sale noteworthy was the home's location on the Dungeness River delta, in an area that is currently exposed to fairly routine coastal flooding, the depth and frequency of which are only going to increase.  By the end of this century it is possible that this lot could flood on every high tide (i.e. see these maps, particularly map #5, assembled as part of this project).  It shouldn't come as a surprise that the infrastructure on this particular property was identified as being highly vulnerable in a quantitative sea level rise vulnerability analysis conducted a few years back.  It seems a lot of money to pay for that sort of risk, but this particular home sales record is yet another indication that, locally, vulnerabilities related to sea level rise or coastal flooding are not influencing local real estate markets, or purchasing decisions.  

Screen grabbed Facebook post that got me going on this topic

This is also relevant because I was just interviewed by invezz.com, a financial investment news and guidance company (here is the article).  They were interested in writing a piece examining if, when and how factors like sea level rise, changing coastal flooding dynamics, or changes to the National Flood Insurance Program, will affect coastal real estate markets.  My overall message was that I do think that there will be influences, and I do think it could be in our lifetime.  That take-away is based on some emerging evidence that real estate impacts due to sea level rise are already detectable in places like Florida, and that the overall real estate market there may have already shed 5 billion dollars of value due to sea level rise-related risk (which seems like, and IS, a lot of money, but is only a small fraction of the total real estate value there).  Its worth noting, though, that even this evidence emerging from a place that is one of the U.S.'s sea level rise hotspots is inconclusive, as evidenced by some of the real estate perspectives voiced in this interesting VICE piece on the Miami real estate market:


Another key unknown, and one that is very relevant to those of us that think more broadly about uses of the coast, is how the sorts of major investments that people are now making to live on the shoreline will affect their decision-making as sea level rises.  In particular, one has to assume that people who have invested so much in shoreline property will go to great lengths to defend it from flooding, which will likely come with societal and ecological costs.  I had the chance, a few years back, to participate in a project that used a modelling approach to assess the social and ecological costs along the shoreline of Grays Harbor county in Washington State assuming that people make every effort to protect their property from flooding as sea level rose.  Not only was the "protect-at-all-costs" approach very expensive, but also led to the greatest reductions in high value habitat and beach accessibility.  There is no reason to hypothesize a different outcome for the shoreline of the Strait of Juan de Fuca, in my mind.  

Wednesday, March 17, 2021

Erosion and (beach, but not bluff) recovery at Kalaloch

12 March 2021 photo of the eroded access stairs below Kalaloch Lodge

Through support from Washington Sea Grant, the North Pacific Coast Marine Resources Committee, and with a research permit from Olympic National Park, I've been prioritizing every-other-month trips out to the beach around Kalaloch Creek to collect beach profiles and other shoreline morphology information.  This post is intended to be a bit of a summary of observations I've made to date.  So first off, some profiles going back to 2017 from the southern edge of my study area, just south of the lodge/cabins:

So these plots have three sub-panels - at the top are all of the profiles collected along a particular transect, and the location of the transect is shown in red in the map at lower left.  The plot at lower right is a time-series of the position of the Mean High Water contour on the transect through time.  In this particular figure note two things - first off the annual cycle in the position of the beach shown in the time-series at lower right.  This seasonal cycle has to do with on-shore and off-shore movements of sand that are associated with seasonal changes in the wave climate, and its a common feature of high energy sandy beaches.  The envelope of variability for the profiles at this site are also huge...the elevation of the beach changes by ~6 feet each year, suggesting that a truly massive weight of sand (something like 300,000-400,000 tons of sand if I did my math right) is potentially being pushed back and forth each year on and off the beach under Kalaloch Lodge. 

The other thing to note in these data is that there is no obvious chronic erosion going on on the beach over this 4 year time-frame (check this out for a bit more on that).  In other words, each year the winter erosion that happens on the beach is countered by accretion in the spring and summer.  Zooming in on data from the last three surveys perhaps illustrates this better, as beach recovery is already occurring after erosion that happened between October and January:

At Kalaloch, though, chronic erosion IS occurring on the bluff.  Since I survey with an RTK-DGPS system I'm not able to survey most of the bluff face, but I can generally collect data on the location of the toe of the bluff, and these bluffs are generally pretty vertical.  The rates of bluff erosion are fastest to the north, nearer to the creek, and have been dramatic this winter:


This erosion is also readily apparent in photos, and has impacts.  The photo at the top of this post comes from the northern section of the beach near to the creek, and the access stairs to the beach here have been closed for a few months.  Here is photo, from a different perspective, of this section of bluff taken on 2 September 2016:

 and more or less the identical location and perspective from just a few days ago, on 12 March 2021:

Its important to note that, unlike beaches, bluffs can't recover naturally.  In other words bluffs don't have any natural mechanism by which erosion is counter-acted.  This has really important implications in regards to attempts to manage bluff erosion using defensive approaches...its incredibly hard and expensive, and failure of the structure over time is more or less assured.  


Monday, February 22, 2021

January 12th was a widespread and damaging event along Washington's shorelines

Various reports of flooding and erosion started rolling after an interesting coastal storm on or around January 12th, and what struck me most was how wide-scale those reports were...in terms of the number of different areas on Washington's Coast, in the Strait of Juan de Fuca and in Puget Sound that were affected in some way.  It really seemed to be a mix of processes (i.e. a high tide, storm surge, swell waves and locally-generated wind waves) expressed in various combinations around the state.   

On the coast and in the Strait of Juan de Fuca there were definitely waves that coincided with a reasonably high tide. - the shot at top is from the base of Ediz Hook right around high tide, illustrating the size of the waves beating on the upper beach of Ediz Hook.  However, around the inside of Ediz Hook waves weren't a factor, but the tide was high enough (the tide gauge in Port Angeles maxed out arund 2.8 ft above MHHW, which is indeed pretty high) to float most of the large wood on the upper beach:


Reports of erosion came in from a variety of places, including Kalaloch out on the coast:


and North Beach near Port Townsend:

Photo Credit:  Bob Simmons/WSU Jefferson County Extension

At Rialto on the coast it wasn't erosion so much as giant wood being thrown like matchsticks on to the National Park Service parking lot:

Photo credit:  Olympic National Park

and a subsequent analysis I did for Olympic National Park (see figure at bottom for the nerd stuff) suggested that the particular combination of tidal water level, storm surge and wave run-up combined to lead to one of the higher total water levels of the last ~13 years at this site.  

Reports from Westport were similar - overtopping of the sea-wall that protects the marina district, and extensive flooding.  This video by the owner of Stiches Quilt and Craft Shop provides a first hand view of the scene:


In Puget Sound its not clear to me how much waves played a role, but I did get at least a few reports of flooding, like this example from the Maple Grove neighborhood on Camano Island:

Photo credit:  Joan Schrammeck

The highest water level recorded in Friday Harbor (the nearest tide gauge to this site) was about 2.5 feet above Mean Higher High Water...a good high tide but certainly nowhere near a record breaker, suggesting that wind likely played some role in forcing this flooding in Puget Sound...

Modelled total water level for Rialto using still water levels recorded at the La Push tide gauge, coupled with run-up estimates modelled using equations from Stockdon et al 2006.  The "Parking Lot Berm Elevation Threshold" is an average estimate of the maximum elevation of the berm seaward of the parking lot at Rialto Beach derived from my own survey data.  This analysis suggests that total water level has only exceeded that berm elevation a handful of times since 2008.