I often hear of the concept of coastal retreat talked of in rather hushed terms, as if it is an impossibility. But in fact, it happens quite frequently, though with very poor tracking and monitoring. As an example I've been following the relocation of a building on Ediz Hook which is now used as our community rowing club's headquarters:
February 2020 photo of the rowing club boathouse on Ediz Hook
This building has been around for quite some time - here it is visible in a 1990 aerial photograph that is included in Google Earth:
1990 aerial image of Ediz Hook showing what is now the boathouse
But placement on, or in this case, over:
April 23 2020 photo of the boathouse showing its seaward overhang and the set of pilings placed on the beach that it rests on
a dynamic shoreline would take its toll on any building, and over time the building sustained enough damage that the costs of keeping it in its current location, I'm assuming, became untenable. As a result, the building was moved. The site above now looks like:
30 April 2021 photo of the former boathouse site
The remaining pilings and framing are slated to be removed this summer, associated with a restoration project led by the Lower Elwha Klallam Tribe.
The building itself is still around, and will continue its life as the rowing club's headquarters...just in a new and hopefully safer location:
August 2016 aerial oblique of a stretch of shoreline on the Dungeness River delta on the Olympic Peninsula. The home referenced below is the 4th from the left.
An associate recently sent me a message, referring me to a Facebook post by a local real estate agency on Washington's Olympic Peninsula. The message read, "Sequim's highest home sale price EVER just closed today!". The thing that made this sale noteworthy was the home's location on the Dungeness River delta, in an area that is currently exposed to fairly routine coastal flooding, the depth and frequency of which are only going to increase. By the end of this century it is possible that this lot could flood on every high tide (i.e. see these maps, particularly map #5, assembled as part of this project). It shouldn't come as a surprise that the infrastructure on this particular property was identified as being highly vulnerable in a quantitative sea level rise vulnerability analysisconducted a few years back. It seems a lot of money to pay for that sort of risk, but this particular home sales record is yet another indication that, locally, vulnerabilities related to sea level rise or coastal flooding are not influencing local real estate markets, or purchasing decisions.
Screen grabbed Facebook post that got me going on this topic
This is also relevant because I was just interviewed by invezz.com, a financial investment news and guidance company (here is the article). They were interested in writing a piece examining if, when and how factors like sea level rise, changing coastal flooding dynamics, or changes to the National Flood Insurance Program, will affect coastal real estate markets. My overall message was that I do think that there will be influences, and I do think it could be in our lifetime. That take-away is based on some emerging evidence that real estate impacts due to sea level rise are already detectable in places like Florida, and that the overall real estate market there may have already shed 5 billion dollars of value due to sea level rise-related risk (which seems like, and IS, a lot of money, but is only a small fraction of the total real estate value there). Its worth noting, though, that even this evidence emerging from a place that is one of the U.S.'s sea level rise hotspots is inconclusive, as evidenced by some of the real estate perspectives voiced in this interesting VICE piece on the Miami real estate market:
Another key unknown, and one that is very relevant to those of us that think more broadly about uses of the coast, is how the sorts of major investments that people are now making to live on the shoreline will affect their decision-making as sea level rises. In particular, one has to assume that people who have invested so much in shoreline property will go to great lengths to defend it from flooding, which will likely come with societal and ecological costs. I had the chance, a few years back, to participate in a project that used a modelling approach to assess the social and ecological costs along the shoreline of Grays Harbor county in Washington State assuming that people make every effort to protect their property from flooding as sea level rose. Not only was the "protect-at-all-costs" approach very expensive, but also led to the greatest reductions in high value habitat and beach accessibility. There is no reason to hypothesize a different outcome for the shoreline of the Strait of Juan de Fuca, in my mind.
12 March 2021 photo of the eroded access stairs below Kalaloch Lodge
Through support from Washington Sea Grant, the North Pacific Coast Marine Resources Committee, and with a research permit from Olympic National Park, I've been prioritizing every-other-month trips out to the beach around Kalaloch Creek to collect beach profiles and other shoreline morphology information. This post is intended to be a bit of a summary of observations I've made to date. So first off, some profiles going back to 2017 from the southern edge of my study area, just south of the lodge/cabins:
So these plots have three sub-panels - at the top are all of the profiles collected along a particular transect, and the location of the transect is shown in red in the map at lower left. The plot at lower right is a time-series of the position of the Mean High Water contour on the transect through time. In this particular figure note two things - first off the annual cycle in the position of the beach shown in the time-series at lower right. This seasonal cycle has to do with on-shore and off-shore movements of sand that are associated with seasonal changes in the wave climate, and its a common feature of high energy sandy beaches. The envelope of variability for the profiles at this site are also huge...the elevation of the beach changes by ~6 feet each year, suggesting that a truly massive weight of sand (something like 300,000-400,000 tons of sand if I did my math right) is potentially being pushed back and forth each year on and off the beach under Kalaloch Lodge.
The other thing to note in these data is that there is no obvious chronic erosion going on on the beach over this 4 year time-frame (check this out for a bit more on that). In other words, each year the winter erosion that happens on the beach is countered by accretion in the spring and summer. Zooming in on data from the last three surveys perhaps illustrates this better, as beach recovery is already occurring after erosion that happened between October and January:
At Kalaloch, though, chronic erosion IS occurring on the bluff. Since I survey with an RTK-DGPS system I'm not able to survey most of the bluff face, but I can generally collect data on the location of the toe of the bluff, and these bluffs are generally pretty vertical. The rates of bluff erosion are fastest to the north, nearer to the creek, and have been dramatic this winter:
This erosion is also readily apparent in photos, and has impacts. The photo at the top of this post comes from the northern section of the beach near to the creek, and the access stairs to the beach here have been closed for a few months. Here is photo, from a different perspective, of this section of bluff taken on 2 September 2016:
and more or less the identical location and perspective from just a few days ago, on 12 March 2021:
Its important to note that, unlike beaches, bluffs can't recover naturally. In other words bluffs don't have any natural mechanism by which erosion is counter-acted. This has really important implications in regards to attempts to manage bluff erosion using defensive approaches...its incredibly hard and expensive, and failure of the structure over time is more or less assured.
Various reports of flooding and erosion started rolling after an interesting coastal storm on or around January 12th, and what struck me most was how wide-scale those reports were...in terms of the number of different areas on Washington's Coast, in the Strait of Juan de Fuca and in Puget Sound that were affected in some way. It really seemed to be a mix of processes (i.e. a high tide, storm surge, swell waves and locally-generated wind waves) expressed in various combinations around the state.
On the coast and in the Strait of Juan de Fuca there were definitely waves that coincided with a reasonably high tide. - the shot at top is from the base of Ediz Hook right around high tide, illustrating the size of the waves beating on the upper beach of Ediz Hook. However, around the inside of Ediz Hook waves weren't a factor, but the tide was high enough (the tide gauge in Port Angeles maxed out arund 2.8 ft above MHHW, which is indeed pretty high) to float most of the large wood on the upper beach:
Reports of erosion came in from a variety of places, including Kalaloch out on the coast:
and North Beach near Port Townsend:
Photo Credit: Bob Simmons/WSU Jefferson County Extension
At Rialto on the coast it wasn't erosion so much as giant wood being thrown like matchsticks on to the National Park Service parking lot:
Photo credit: Olympic National Park
and a subsequent analysis I did for Olympic National Park (see figure at bottom for the nerd stuff) suggested that the particular combination of tidal water level, storm surge and wave run-up combined to lead to one of the higher total water levels of the last ~13 years at this site.
Reports from Westport were similar - overtopping of the sea-wall that protects the marina district, and extensive flooding. This video by the owner of Stiches Quilt and Craft Shop provides a first hand view of the scene:
In Puget Sound its not clear to me how much waves played a role, but I did get at least a few reports of flooding, like this example from the Maple Grove neighborhood on Camano Island:
Photo credit: Joan Schrammeck
The highest water level recorded in Friday Harbor (the nearest tide gauge to this site) was about 2.5 feet above Mean Higher High Water...a good high tide but certainly nowhere near a record breaker, suggesting that wind likely played some role in forcing this flooding in Puget Sound...
Modelled total water level for Rialto using still water levels recorded at the La Push tide gauge, coupled with run-up estimates modelled using equations from Stockdon et al 2006. The "Parking Lot Berm Elevation Threshold" is an average estimate of the maximum elevation of the berm seaward of the parking lot at Rialto Beach derived from my own survey data. This analysis suggests that total water level has only exceeded that berm elevation a handful of times since 2008.
I'm sitting in Friday Harbor at the moment, teaching at Friday Harbor Labs for the quarter. Yesterday we were hit by a little storm, characterized mostly by rain and some strong-ish south winds - the video above was shot at South Beach on San Juan Island in the afternoon), but what made this storm notable from a coastal stand-point is its co-occurrence with a higher-than-usual astronomical tide. This led to higher-than-average water levels, something with an average annual return frequency of approximately 3 years on the coast, and maybe 1-2 years in Puget Sound. However, in some places water levels on the shoreline were exacerbated further by run-up associated with waves.
Some visuals of the event: here on San Juan Island the ocean was interacting with large wood on the very upper part of the shoreline for most of the day. Here is a time-lapse of the shoreline on South Beach covering most of the day, in which you can make out large wood getting pulled into the swash zone and moved rapidly alongshore:
On the more protected shores on the other side of Cattle Point, where wood tends to accumulate lower on the shoreline, large wood was afloat, but not moving anywhere as rapidly:
So lets look at some numbers. First off here are the magnitudes (in meters relative to Mean Higher High Water) and times of the peak still water level, as measured at tide gauges in coastal Washington:
Peak still water level measured at tide gauges in coastal Washington on 17 November 2020. The time of the peak is given on top of each bar.
So a few things jump out. First, the peak water levels, relative to each stations local MHHW, were much higher on the coast than in Puget Sound (addendum: Check out this footage from Westport, Washington!). Next, the time of that peak, perhaps not surprisingly, was generally associated with the peak of the largest high tide of the day...on the coast and in the Strait the highest astronomical tide occurred in the afternoon, whereas in Puget Sound it was in the morning. The one exception was in Port Townsend, where the highest astronomical tide occurred in the morning around 7am, but the peak water level occurred in the afternoon. This happened because of the extra push provided by the non-tidal residual...which brings us to the second big process that occurred yesterday, a substantial non-tidal residual associated with low pressure and wind, that elevated water level well above predicted:
Peak non-tidal residual (NTR) measured at tide gauges in coastal Washington on 17 November 2020. The time of the peak is given on top of each bar.
So again, the NTRs varied between the coast and Puget Sound, and were relatively large - approaching 1 meter on the coast, and 0.6 meters in Puget Sound. The timing of the peaks was also quite interesting...generally the largest NTRs occurred on the coast in the morning, and in the early afternoon in Puget Sound. This turned out to be really important, as the peak NTRs were out of phase with the highest tides in each location. This is good, as it helped to reduce the peak water levels for the day. If they had been in phase we would have definitely seen some water level records broken in Washington State yesterday.
To assess the influence of waves on south-facing shorelines I was also able to survey water level elevations on South Beach right around 8am...and found that the run-up elevations were ~0.81 meters relative to MHHW. At the same time the tide gauge in Port Townsend was reading a still water level of 0.45 m MHHW, and in Friday Harbor 0.64 m MHHW...suggesting that wave run-up was responsible for elevating water level on the shoreline an additional ~0.2 to 0.4 m. I suspect that this component was a bit higher later, as the wind picked up quite a bit.
Dungeness Spit is an awesome place to study the dynamics of spit morphology - its long and largely un-modified, with un-modified bluffs to the west that presumably supply sediment for its on-going growth. And grow it has. Schwartz et al. (1987) estimated an average annual rate of progradation of the spit of 4.4. m/yr, based on an analysis of 4 data-sets (either survey maps or aerial photos) collected between 1855 and 1985. I walked into this effort thinking that what I would learn about spit progradation would be how much that average rate of positive growth varied annually. Indeed, after my first year of surveying (2013) I could see that the end of the spit grew by roughly 5 meters or so based on a comparison to an aerial LiDAR dataset collected in 2012:
Intertidal profile data along a transect bisecting the very tip of Dungeness Spit for 2012, 2013 and 2014. 2012 data are from aerial LiDAR, 2013 and 2014 are from topographic GNSS surveys.
Exactly as expected. Since then, though...things have been a little different, with an average annualized erosion rate on the end of the spit of roughly 8 meters/yr. That is ~25 feet per year of erosion on average:
Same location and data as are shown above, but for 2013-2020, all GNSS surveys.
Instead of finding myself analyzing the annual variability in spit growth, I'm trying to interpret the annual variability in erosion...and it does vary. Some years there is more...and some years virtually none. But the trend here is unmistakable, and fascinating, and vexing. What is going on?
Its worth noting that this erosion at the very end of the spit is NOT representative of the spit as a whole. Largely the rest of the spit, especially the long skinny "strand" connected to land, is astonishingly stable. I started out this study hypothesizing that I might see a very slow rate of migration of this part of the spit, associated with storm-driven overwash. But I don't. Year after year the beach and crest are in an almost identical position despite being regularly battered in the winter:
GNSS survey-based profile data along a transect at roughly mile 2.5 on Dungeness Spit.
So what is going on? I'm not totally sure, and in fact I don't really have too many ideas that I can even use to formulate a proposed mechanism. And there don't appear to be too many analogous observations that I can find from the limited number of papers out there describing spit dynamics. There is at least one exception, though - this paper describes a spit on the shoreline of the North Sea that, based on sedimentary evidence, has grown in fits and starts, with periods of growth alternating with periods of erosion. In a conversation with Maury Schwartz some years ago, he described to me a model of spit growth that required that the spit build out a sub-tidal platform before it could grow sub-aerially...which would manifest in a data set like mine as periods of no- or low-growth punctuated with periods of rapid growth. That's not really what I see in my data...but Maury thought hard about these things and I'm still trying to fit my observations into that model.
I wanted to try to visit Tongue Point during a low tide this spring. This basalt outcrop (part of the Crescent Formation) is generally a pretty popular and heavily impacted tide-pooling area, but I figured that since the adjacent campground has been shut down, it might have reduced some of the pressure on the intertidal community. I made the trip with McHenry and Theo as an alternative to the usual at-home schooling we are doing, and we ended up spending most of our time here. This is a bit of what we were able to see in an hour or so of rooting around.
Carnivorous Nucella sp. (Dog Whelk) and eggs
Adult Pisaster ochraceous, the only one we observed
Halosaccion grandiforme (Sea Sac!), a super widely distributed red algae
A rosette of Pollicipes polymerus (Goose barnacles)
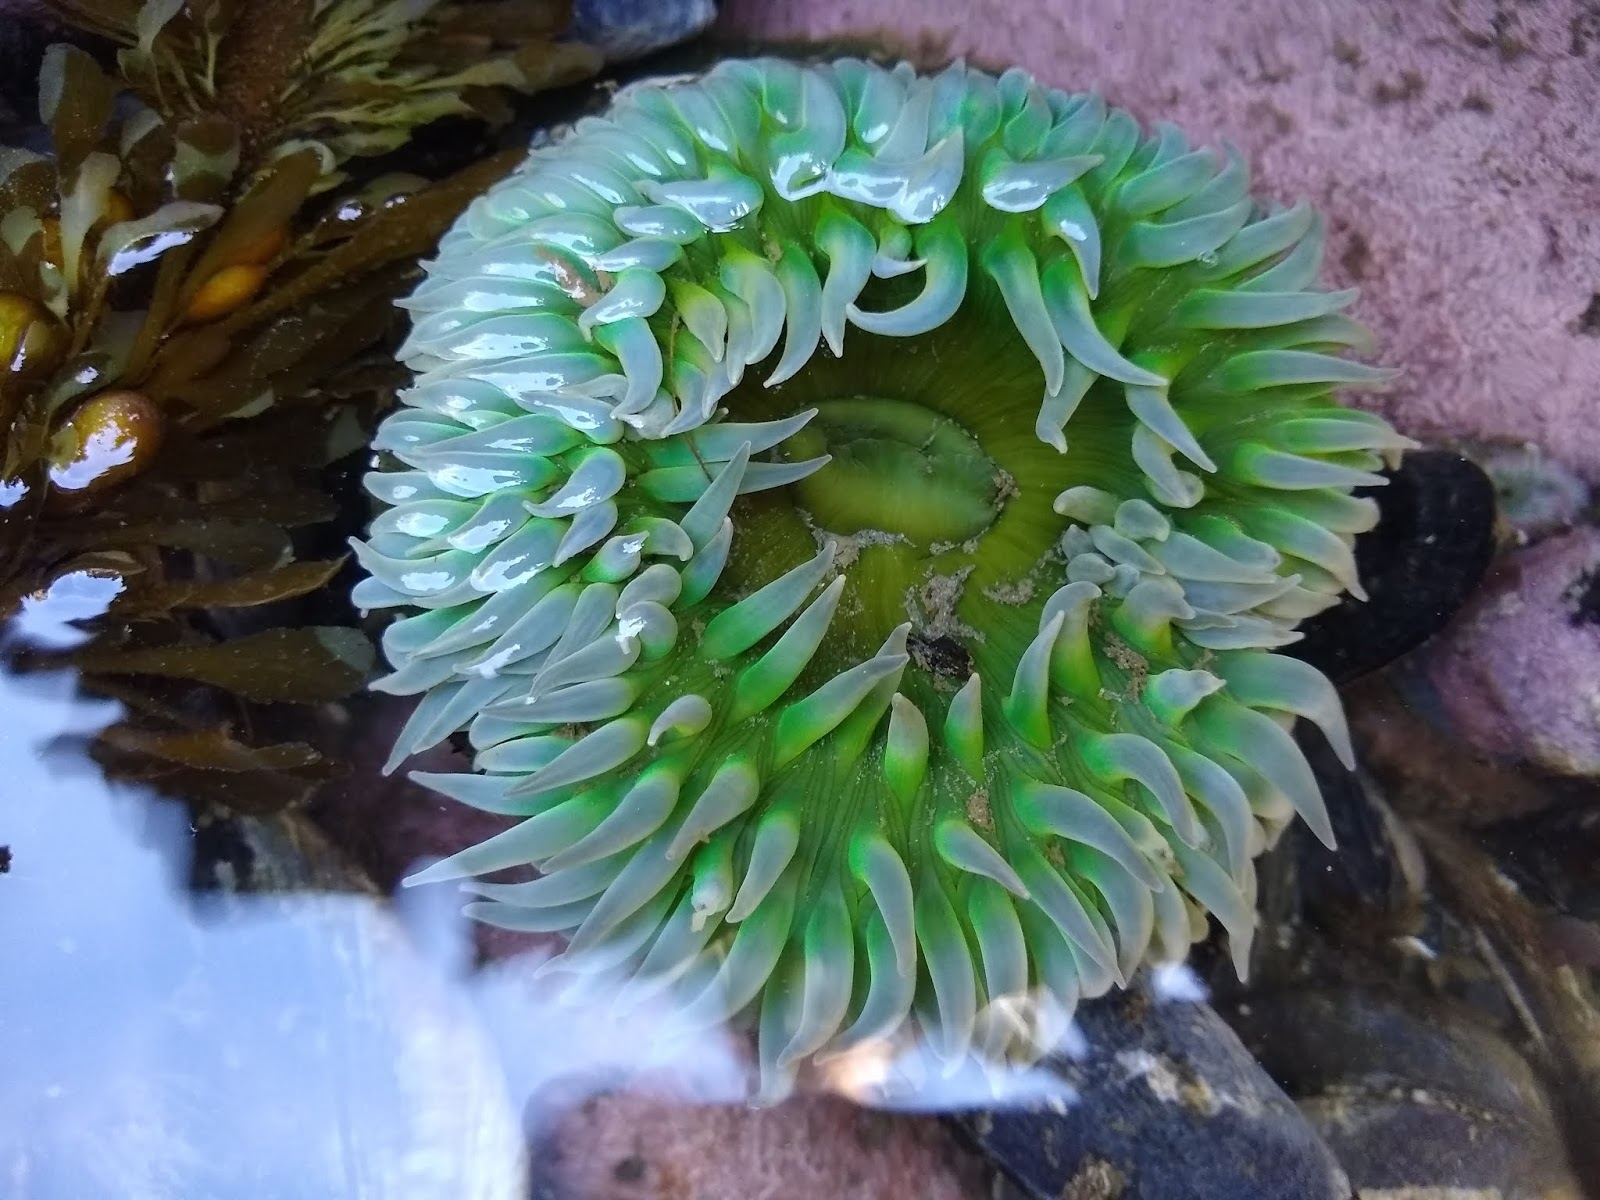
Anthopleura xanthogrammica (Giant Green Sea Anenome)
A pot of gold! Egregia menziesii (Feather Boa kelp) and Hedophyllum sessile (I think; Sea Cabbage kelp)
Anthopleura sp., likely Anthopleura sola. My field team does a lot of "feeding" of anemones on these trips, but this one came by this meal all on its own. Cool to see.
Acanthodoris nanaimoensis, the Nanaimo dorid. Our only nudi on this trip.
Eudystilia sp., probably vancoverii. A Pacific coast feather duster worm. One of my favorites
Haliclona sp. I think (This one doesn't appear to have a common name...but it needs one). Super cool sponge
Diodora aspera (Keyhole Limpet). This one was in a group of maybe six individuals. Haven't seen a congregation like that before
Juvenile Henricia sp. (Mottled Henricia; probably sanguinolenta?) I can't keep track of the Henricia's :)